
When the S&P 500 Lies: A Simple Signal to Spot Market Concentration
The S&P 500’s strong performance hides a deeper truth: most returns now come from a handful of mega-caps. This article explains how comparing the market-cap S&P 500 with its equal-weight counterpart reveals shifts in market breadth—and how a simple rotational strategy can dramatically improve long-term returns.
11/25/20252 min read


The S&P 500 is a U.S. equity index that reflects the performance of the broad American stock market. Each company’s weight in the index depends on its market capitalization—the larger the company, the heavier its weight. In recent years, traditional value investors have significantly underperformed the S&P 500. It feels as if value investing “no longer works.” But why?
The methodology of value investing is still sound. The real issue is that S&P 500 performance has become increasingly concentrated. A very small number of companies have been driving most of the index’s returns. At the time of writing, the largest contributors include Apple, Microsoft, NVIDIA, Amazon, Alphabet, Meta, Berkshire Hathaway...
To me, this reflects a shift in market regime. The key question becomes: How can we tell whether U.S. equity growth is being driven by a handful of mega-caps or by the broader market?
Surprisingly, the answer is straightforward. After much iteration and testing, I found that the most effective approach is comparing the performance of the traditional market-cap-weighted S&P 500 with an equal-weight version of the same index.
To formalize this, consider the difference between:
the S&P 500 (market-cap-weighted, MCW)
and the S&P 500 Equal Weight Index (EWI).
Using the Z-score of their relative performance ratio, we can identify four market regimes: Upward (MCW), Downward (EWI), Reverse Downward (EWI), and Reverse Upward (MCW).
Next comes the backtest. SPY can be used as a proxy for the market-cap-weighted index, while RSP tracks the equal-weight version. Let’s call this approach Rotational Investing.
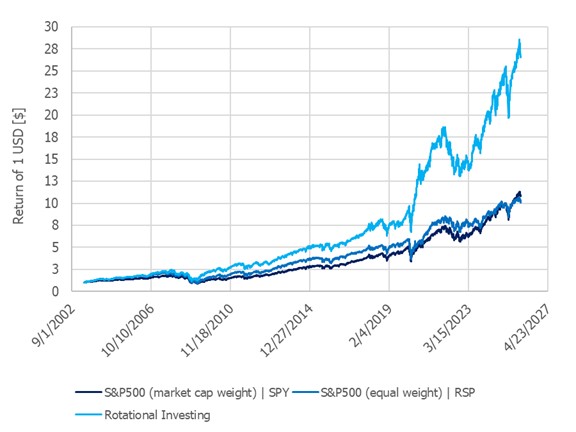

The results are compelling. Rotational Investing boosts the compound annual growth rate (CAGR) by roughly five percentage points—from about 13% for both SPY and RSP individually to around 18% when switching between them. The maximum drawdown remains similar across all three cases, which is expected: this strategy is equity-only, and when the broad market falls, nearly all stocks (and most asset classes) tend to move together.
But the long-term effect is dramatic. Over a 20-year period, a $10,000 investment would have grown to roughly $267,000 using Rotational Investing, compared with about $100,000 for either SPY or RSP alone.
How do you use this in practice?
Think of it as a diagnostic indicator. If you invest in individual stocks, checking it weekly or monthly helps determine whether your portfolio should emphasize fast-growing, high-PE names like NVIDIA, Amazon, or Google—or whether it’s time to focus on undervalued companies trading below fair value.
If, like me, you prefer quantitative ETF strategies, this becomes a daily signal telling you whether to hold SPY or RSP.