
Inflation, Income, and Investment: Understanding PPI, CPI, and PCE
Understand how PPI, CPI, and PCE shape inflation trends and what happens when income growth lags behind. Learn which sectors and ETFs perform best across different inflation cycles.
10/23/20253 min read
Inflation is one of the most powerful forces shaping both economies and markets. Yet, when investors and analysts talk about inflation, they often refer to different indicators that measure it in different ways. The most common are the Producer Price Index (PPI), the Consumer Price Index (CPI), and the Personal Consumption Expenditures Price Index (PCE). Each of these metrics captures a different stage of the price formation process, and understanding how they relate to one another is essential to interpret the health of the economy — and to position investments accordingly.
The Producer Price Index (PPI) measures price changes from the perspective of producers — in other words, what businesses receive for their goods and services. It reflects the evolution of input costs and tends to move earlier in the economic chain. A rise in PPI often signals that consumer prices may follow, as companies eventually pass higher costs onto customers.
The Consumer Price Index (CPI), by contrast, measures what households actually pay for goods and services. It focuses on out-of-pocket expenses, from groceries to housing and transportation. Because CPI captures the consumer experience directly, it is often perceived as the most tangible indicator of inflation for the average person — the one that determines how much more expensive everyday life has become.
Finally, the Personal Consumption Expenditures Price Index (PCE) offers a broader and more refined view. Unlike CPI, which is based on a fixed basket of goods, PCE adjusts for changes in consumer behavior. It also includes expenditures made on behalf of households, such as healthcare paid by employers or government programs. For this reason, PCE tends to rise more slowly and is considered a smoother, more comprehensive measure of inflation. It is the preferred gauge of the Federal Reserve when setting monetary policy.
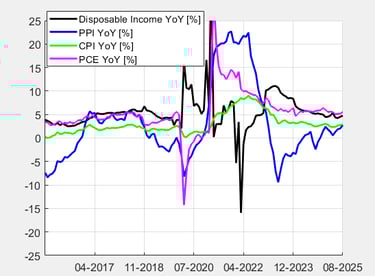
When comparing these three indicators over time, an interesting hierarchy emerges. In most stable periods, their year-over-year rates of change tend to rank as follows:
PPI < CPI < PCE. During periods of supply stress or commodity shocks, however, PPI may temporarily surge above CPI and PCE, as seen during the 2021–2022 inflation spike.
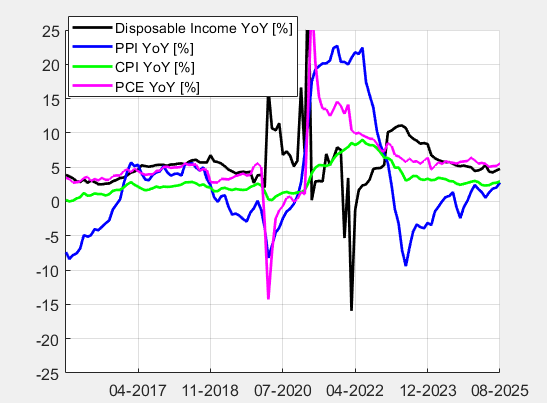
Understanding how these measures evolve is crucial when analyzing personal income. For households to maintain purchasing power, income growth must at least keep pace with inflation — ideally with PCE and CPI. When personal income grows faster than these indices, real income rises, giving consumers more discretionary spending power. Conversely, when inflation outpaces income, consumption slows, savings erode, and the overall economic mood tends to darken.
In a healthy economy, personal income should grow around 4–6% year-over-year when PCE inflation hovers near 2–3%. This margin allows consumers to expand their real spending without relying on debt. When income growth falls short of PCE, it signals a loss of real purchasing power — a red flag for sectors dependent on discretionary spending. In contrast, strong income growth relative to inflation tends to fuel consumption in areas like travel, technology, and luxury goods.
From an investment standpoint, these relationships help identify which sectors or exchange-traded funds (ETFs) are likely to perform best under different inflation-income dynamics. When inflation is contained and income growth is strong, the environment favors consumer discretionary stocks and growth-oriented ETFs such as XLY, QQQ, or SPY. Stable inflation expectations also tend to support high-valuation sectors like technology, which benefit from lower discount rates and expanding margins.
When inflation begins to erode real income — with CPI and PCE rising faster than wages — the balance shifts. Households prioritize essentials, and defensive sectors like healthcare (XLV), utilities (XLU), and consumer staples (XLP) gain relative strength. In more severe cases of cost-push inflation, when PPI leads CPI upward, investors may seek refuge in energy stocks (XLE), commodities (DBC), or inflation-protected bonds (TIP).
The spread between CPI and PCE can also offer clues about market sentiment. A narrow gap signals stable consumer behavior and confidence, while a widening one often reflects stress or rapid price adjustments. In this sense, monitoring both inflation indicators alongside income growth gives investors a deeper view of the economic cycle than relying on headline CPI alone.
In conclusion, while PPI, CPI, and PCE are all measures of inflation, they represent different perspectives of the same story — from producers to consumers to the broader economy. Their interplay with personal income growth reveals the true pulse of economic well-being. When real income outpaces inflation, growth sectors thrive and optimism prevails; when it falls behind, defensive positioning and inflation hedges become the rational choice. For investors, understanding these subtle relationships is not just an exercise in macroeconomics — it’s a guide to navigating the cycles of opportunity and risk that define the markets.